In a previous article, I wrote about finding sequential calls that could be parallelized. Today, I wish to address another issue with an algorithmic angle : finding and optimizing code performance issues in C#. In particular string allocations and algorithmic time complexity.
Story time
Just like in the previous post, I was investigating performance stuff back in May 2023. After fixing a couple of problems with our dependencies, I wanted to have a look at how our APIs were doing in production. Sure, I could see the big picture in Application Insights’ Performance view with a nice breakdown by route and even seeing how each dependency fared. But I lacked the insider view telling me which parts of our code that challenged the CPU or the memory intensively.
Application Insights Profiler
After a quick chat with our Azure expert, I found out we could activate a profiler directly in Azure. This profiler has an overhead, therefore activating it would take its toll on our websites’ performance. So we agreed on activating it for a short period of time, see how it behaved and reiterating or not.
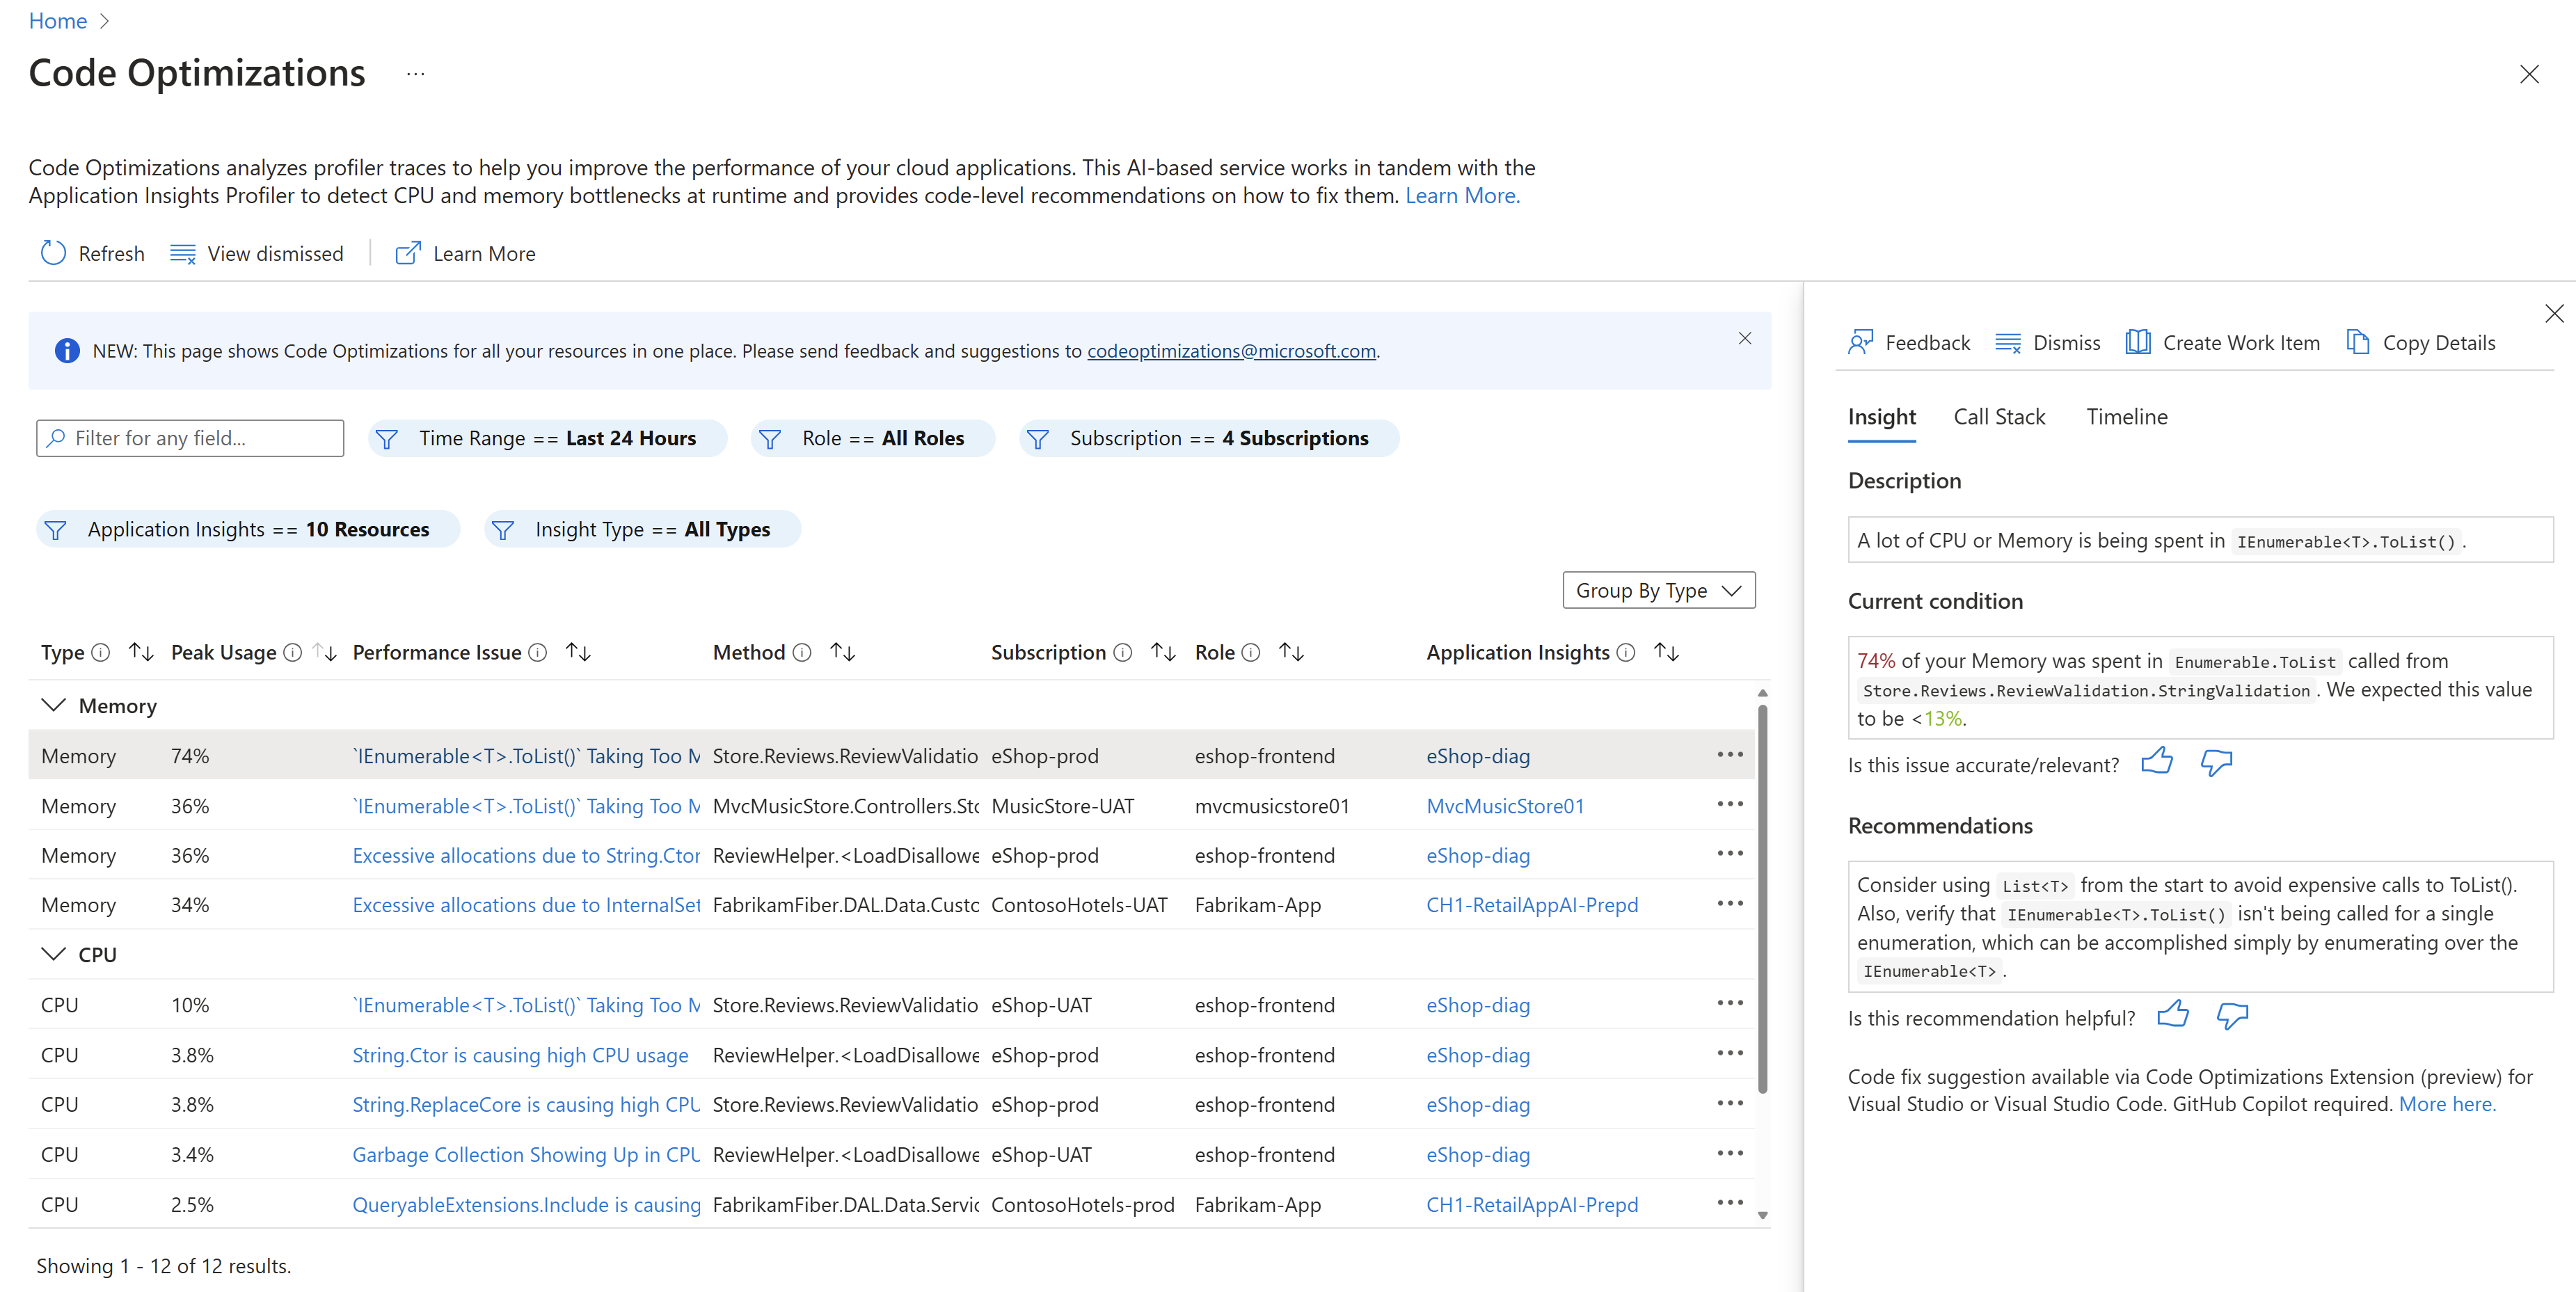
We ended up activating it during a few hours for a couple of days. It gave me access to the Code Optimizations page which lists some potential performance issues that Azure observed when the profiler was enabled.
First discoveries
At the top of this list, I found a few things I had no control over : deserialization of database calls, GraphQL task scheduler, Regex calls (be very careful to follow best practices when playing with Regex !)… However, I ended up finding something weird that allocated quite a lot of objects and ate up CPU as well 🤔 I took a look at the code and…
public static string? GetTranslation(IEnumerable<TranslationCacheDto> translations, string itemName)
{
    return translations.FirstOrDefault(t => $"cache.key.{itemName?.Replace("/\\s/g", "").ToLower()}".Equals(t.CacheKey, StringComparison.InvariantCultureIgnoreCase))?.TranslatedText;
}Well, it’s messy to say the least and it was a one-liner expression body originally. As I learned over time, it’s usually a good idea to break one-liners down to properly understand them. In our case, the bulk of the logic is located in the FirstOrDefault() predicate. Here’s what the code does in a nutshell :
- Replaces something inside the
itemNamegiven in parameter ; - Then converts it to lowercase ;
- Then appends it at the end of the “cache.key.” string ;
- Then compares it with each translation’s
CacheKeyproperty, ignoring case and using the invariant culture. - Finally, returns the first matching translation’s
TranslatedTextproperty or null.
First leads
A few things come to mind here :
- Applying
ToLower()AND comparing string with anInvariantCultureIgnoreCasecomparer both achieve the same results. So we can safely remove thisToLower()call and keep the custom comparer. That would get rid of a useless string allocation for each iteration inFirstOrDefault(). - The string concatenation achieved through interpolation is performed at every iteration of the IEnumerable. We can perform this interpolation outside the
FirstOrDefault()for a nice boost in memory allocation. - That
String.Replace()call looks fishy. It seems the original developer intended to pass a Regex here to remove whitespaces but…String.Replace()does not handle regular expressions. For what it’s worth, I checked in the database that none of the items contains the “/\s/g” string.
Looks like we can easily improve things over here ! I added a few tests to make sure I wasn’t breaking things and went on with my fix. But how do I make sure I actually fixed something ?
Sample code !
Let’s implement the original and “fixed” code
This first analysis looks promising on paper but let’s test it. To this end, I have created a dedicated repository ; feel free to have a look. The BadImplem class is the one hosting the original algorithm. The ImprovedImplem contains the improvements listed above, which gives the following code :
public static string? GetTranslation(IEnumerable<TranslationCacheDto> translations, string itemName)
{
    var key = $"cache.key.{itemName}";
    return translations
        .FirstOrDefault(translation => key.Equals(translation.CacheKey, StringComparison.InvariantCultureIgnoreCase))
        ?.TranslatedText;
}Is it possible to improve this somehow ? Well, the point of this algorithm seems to be looking out for a specific value and then returning it. By iterating over a list and compare each item, the time complexity of the algorithm is O(n). Practically, iterating once every now and then over 10 items would not be a big deal performance-wise. But looking at actual numbers in our production environment, it appeared that the list contained 50,000+ items and the algorithm was used several times per second. That’s not good, these improvements may not be enough.

Thinking in O(1)
This is one case where I’ll immediately think of using a Dictionary. Retrieving an element from a Dictionary has a time complexity of O(1), the fastest possible way. There would be some overhead when creating the Dictionary though, so we’ll need to measure that as well. Anyway, I added the following code to build the Dictionary in Program.cs :
void InitializeDictionary(Dictionary<string, string> dictionary, TranslationCacheDto[] translationDtos, string[] itemNames)
{
    for(var i = 0; i < 50000; i++)
    {
        dictionary.Add(itemNames[i], translationDtos[i].TranslatedText);
    }
}And the following trivial code to read from the Dictionary :
public static string GetTranslation(IDictionary<string, string> translationsByItemName, string itemName)
{
    return translationsByItemName[itemName];
}Measures
OK so now we’ll see how these 3 approaches compare with each other. Take a look at the Program.cs. Basically, once the data and the dictionary are set up, we will try 1000 times to retrieve a random value. Then we will look at how much CPU was used and how many memory allocations were made in this operation.
We build the solution in Release mode, hit Alt+F2 in Visual Studio, select the CPU Usage profiler aaaand…
CPU usage

There we have it. Now we can say with confidence that the first improved version almost halves the CPU usage.
What else ? Obviously the O(1) implementation beats everyone hands down. Even building the Dictionary is only a fraction of the cost of the other approaches. Building the Dictionary AND looking up for random values take 1/100th of the cost of the original version ! Surely this is the best method ? Not so fast, let’s measure the memory allocation first. (Note : in order to shorten analysis duration, I lowered the number of random items to find from 1000 to 200)
Memory allocation
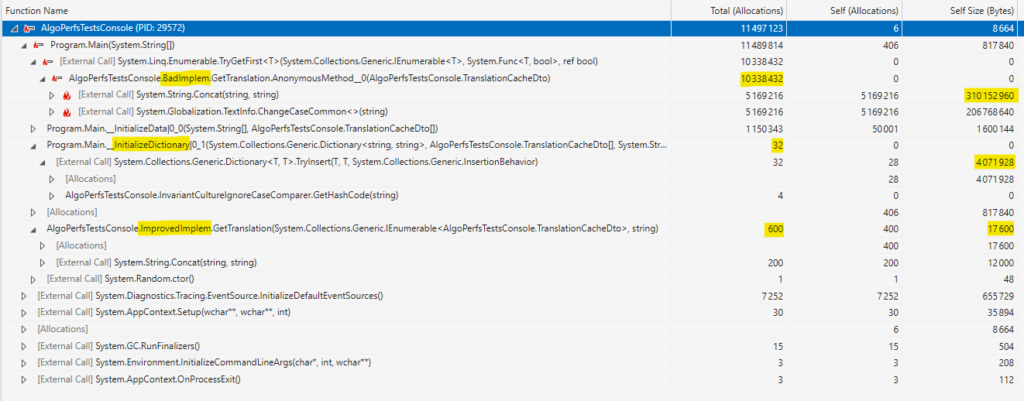
Indeed, the Dictionary initialization allocates very little objects (of course, the TranslationDtos were already created by InitializeData()). But it eats a non-negligible amount of memory, almost 4 MB. And ImprovedImplem has very little allocations AND takes virtually no memory.
Conclusion
So what conclusion can we draw from all this ? Like many answers when it comes to development “it depends“. Sure, the first implementation is not optimal so it’s probably safe to pick one of the other two. But which one ? Every solution has its pros and cons and I have proposed only 2 solutions.
If you face a context where you have to rebuild the Dictionary from scratch at every request and are limited in the amount of memory you can take, then the ImprovedImplem in O(n) would be worth considering. But if CPU consumption is a concern or if using 4 MB of memory temporarily is not an issue, I would probably go with the Dictionary implementation.
Another important lesson that can be learned here is : be very careful each time you manipulate strings and perform string comparison ! Strings are immutable, therefore each modification will require lots of memory allocation.
I have barely scratched the surface of what can be done with profilers. The idea was to give you a glimpse on some basic code as well as a quick introduction to available tools. I hope it was useful ! To go a step further, you can have a look at the BenchmarkDotNet library that offers advanced benchmarking tools and measures.