Recently, I had to investigate a memory leak detected in our production environment. Memory leaks are a nightmare for many developers :
- There’s often no clear reproduction scenario.
- It requires us to be knowledgeable about internal mechanics of how memory is handled in our programming language (yes I know, “real developers should know about it”).
- The symptoms might not occur after a while, sometimes as a side-effect of something that looks completely different.
- Once they are visible though, the symptoms can be very strong and endanger the production environment.
I am no memory management expert ; however, given I know a bit about garbage collection in C# and I have a tool that can help me investigate, I will try in this post to recap what I have learned over the past few days. Hopefully this article will help you investigate and fix memory leaks in your .Net Core application !
Context
I currently work as a freelancer for a hospitality client, mostly working on various APIs written in C# and deployed in Azure as App services. Recently, our Azure experts who also act as our Ops team warned us that they had to redeploy our main backend manually on a regular basis because they had several “memory threshold” alerts popping up. Every few days, they would get an alert, redeploy the app service and wait. Then the problem would occur again in another few days.
Besides the obvious “add some more RAM” answer that could be valid in some contexts but not here, it was quite clear we had to find the root cause and fix it.
Where do I start ?
Metrics
The first thing to do is to check the metrics on Azure Portal ; here’s what the memory consumption chart looks like :
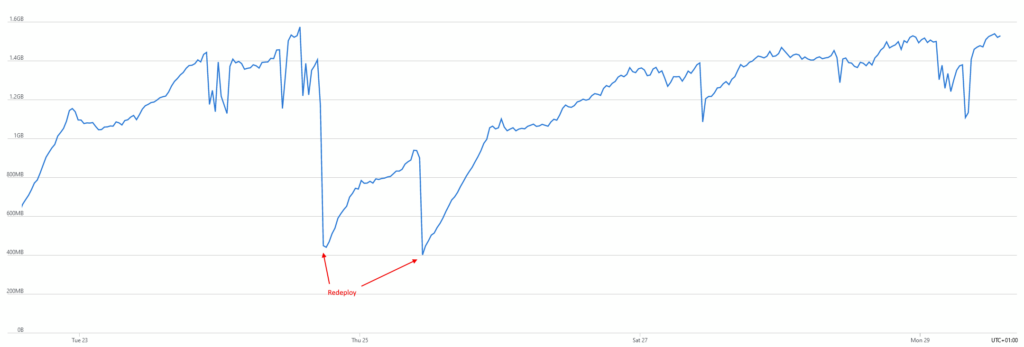
Our release train was acting as a regular redeployment of the API, effectively resetting the memory.
The memory leak becomes quite obvious : the memory consumption keeps on growing, until it reaches a threshold matching the server’s specs. We can see some local drops here and there, but they are not nearly enough to break the uptrend. The only way to clear the memory is to reset the application which in our case was redeploying the app.
The release train
How come we haven’t seen it sooner ? Surely the alerts were set up years ago so that’s not new. After a few discussions, we realize it’s connected to the way our team works : the release train. Every Tuesday, we push a new version of our API into production. However, these past few weeks, we were working on a big migration for our payment system and have halted deployments until all bugs are solved. And that’s the thing : our release train was acting as a regular redeployment of the API, effectively resetting the memory until next Tuesday. It’s possible the memory leak had been there all along ! Maybe the “add more RAM” hack was actually good advice here ?
Anyway, now that I’m onto it, I’ll try to fix it. If I end up not being able to find the flaw or fix it, then I will check with our Ops what we can do to mitigate the issue. Now that we know there is a memory leak, how can we find what’s wrong and then fix it ?
Memory dumps
A good start is to use a memory dumps. Memory dumps are snapshots of the memory used by a process. In .Net Core, lots of information are stored in these files which can make them a little scary or even useless without the right tools. Visual Studio can open and exploit them ; personally I like using Jetbrains’ dotMemory. It’s not free but since I own a licence for most Jetbrains’ tools, I can use it easily.
Now we know how we will be able to open those snapshots, we just need to actually create them. There’s a nice thing with Azure in that you can get a memory dump in a few clicks (“Diagnose and solve problems” –> “Diagnostic tools” –> “Collect Memory Dump”) or by asking your Azure experts/admins.
First analysis
Let’s open our memory dump. This is what the opening screen looks like with dotMemory :
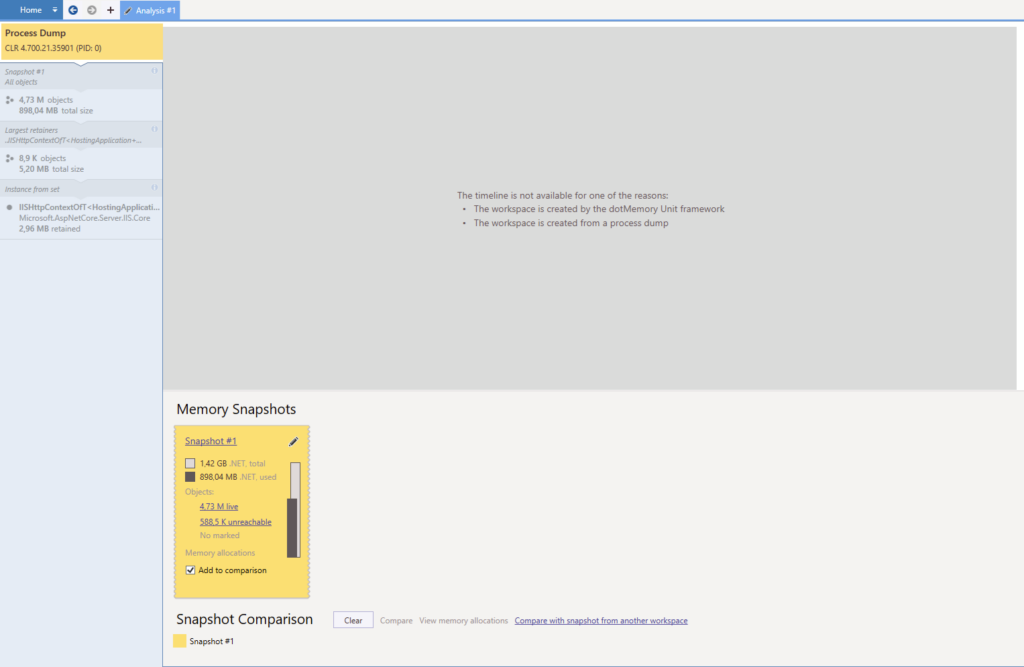
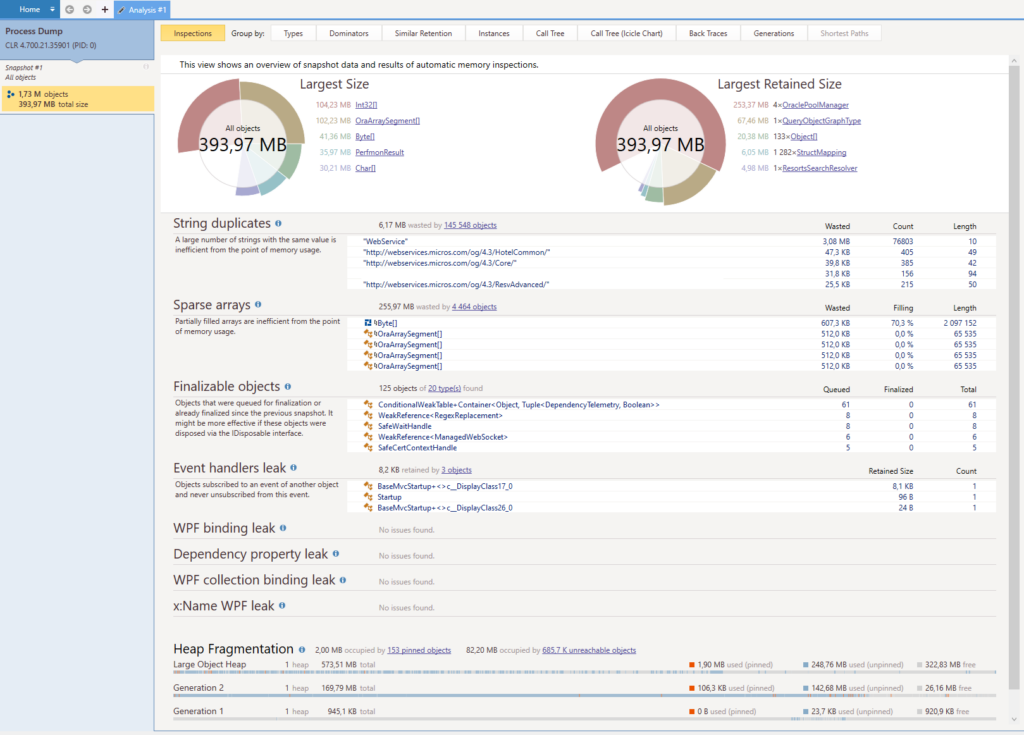
And here’s what happens when we click on the “Snapshot #1” link in the yellow rectangle :
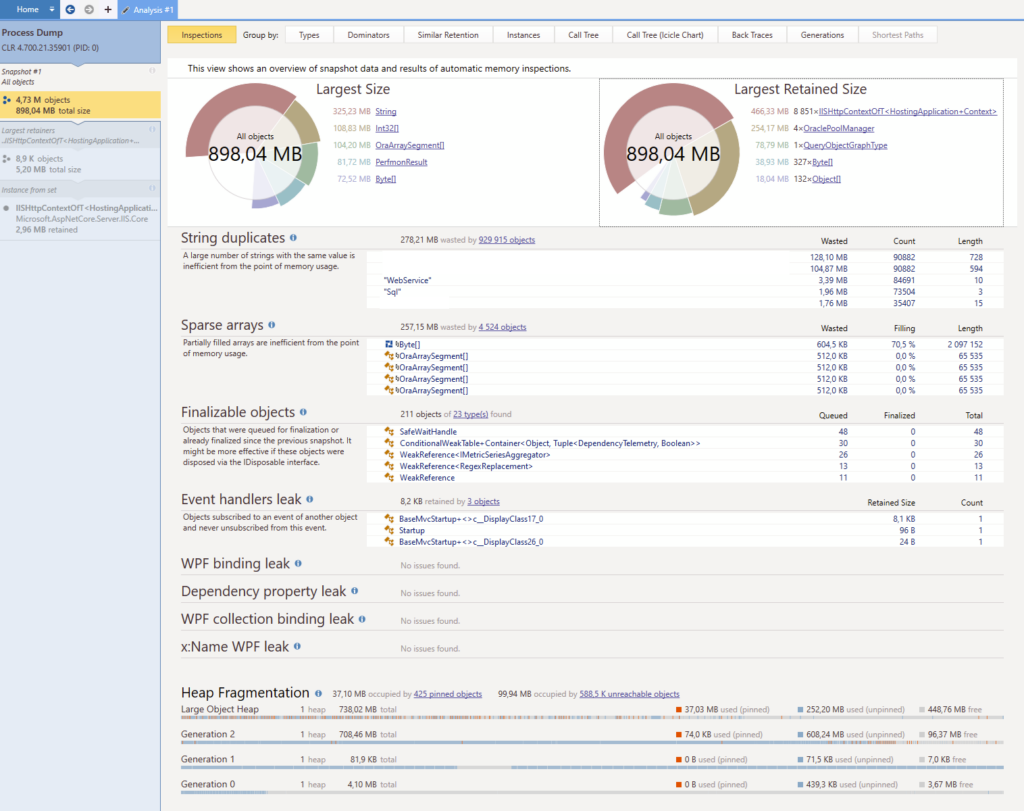
Pretty scary huh ? Well like I said above, memory dumps contain lots of information, especially this one here because it weighs a whopping 2.4 GB. All of these information are good. They will provide us with different leads or propositions that will help us narrow down where the problem might reside.
First impressions
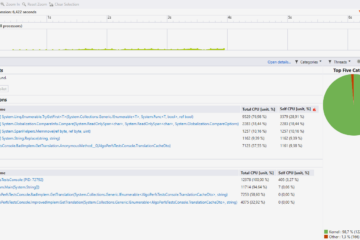
In order to understand the main sections of the overview, reading dotMemory’s documentation is important.
There are several key points in the screenshot above :
- 2 types of objects seem to retain more than 75% of the memory : OraclePoolManager (4 instances) and IISHttpContextOfT<HostingApplication+Context> (8851 instances).
- There are 2 serious string duplicates, and they are hopefully easy to fix.
- Lots of memory is retained in Generation 2 of the garbage collector, meaning there really is a memory leak since all these objects are considered “long-lived”.
OraclePoolManager is a known problem ; we keep live connections to Oracle as singletons for performance purpose and the internal objects in the Oracle drivers keep growing. We will have to find a long-term solution eventually.
For now, let’s focus on the mysterious IISHttpContextOfT<HostingApplication+Context>. I will switch the narration to a more personal style in order to describe my thought process and what lead me to, I believe, a solution.
Digging deeper
So. IISHttpContextOfT<HostingApplication+Context>. I am a bit startled with this because 1) I have never encountered it before, 2) it has a really weird name and 3) it looks like some internal IIS stuff. Of course I have heard about the “HttpContext” part, we actually use it in our code here and there, but that doesn’t help me much. On top of that, web searches are not very helpful. What to do ?
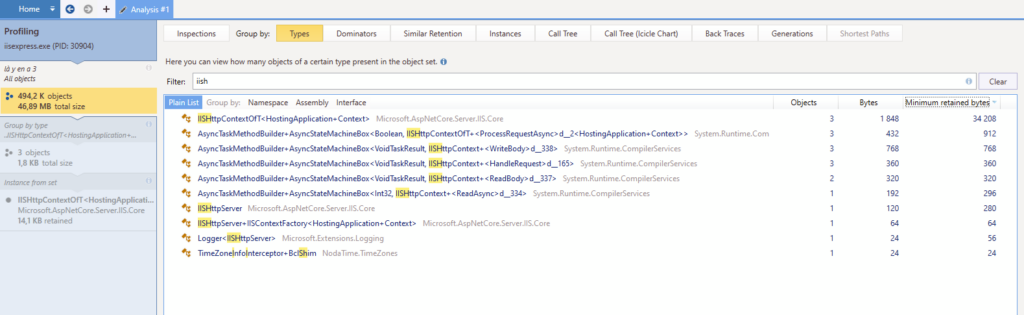
First, I notice on the screenshot that each class name is underlined in blue and that means we can click on it. I do just that and here’s what pops up :
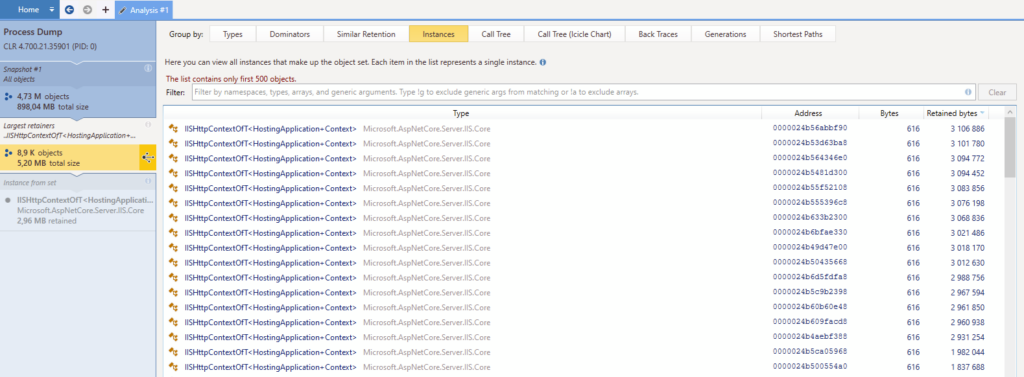
OK so I get a list of all instances. The tabs on top had an appealing “Call Tree” but that feature is unfortunately not available in this case. Again, each instance is double-clickable and that brings us to the following screen, with a special interest in the “Key Retention Paths” tab :
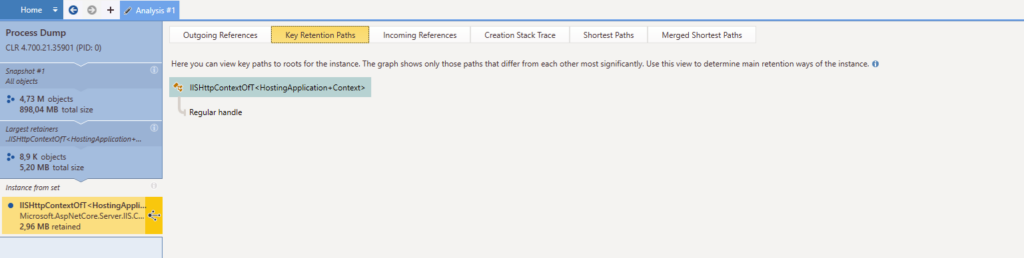
Yeah well, nice try. What I was expecting here was a chained list of which object(s) were holding this one in memory ; maybe lead me to a singleton I had not noticed earlier, or an object that I would recognize. Anything that would help me, really. But nope.
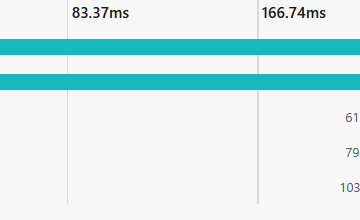
However, there is an “Incoming References” tab. That might help me identify something in order to narrow down my search, let’s see :
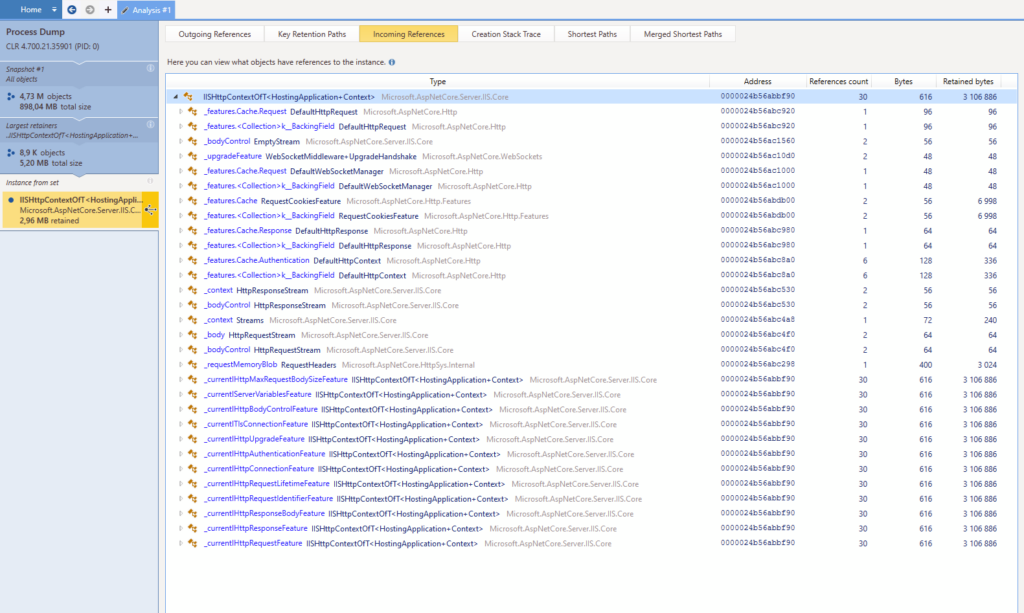
OK that’s not great but that’s something. I’d rather have too much information than too little. This isn’t super helpful but what catches my attention are the “WebSocket” and “Stream” keywords. We get lots of connections each day on our websites, and the fact that “only” 8,000 objects are retained in memory suggests an uncommon scenario. Link that to the keywords above and what sparks in my mind is “hey, what if it’s related to websockets somehow ?”
Narrowing it down
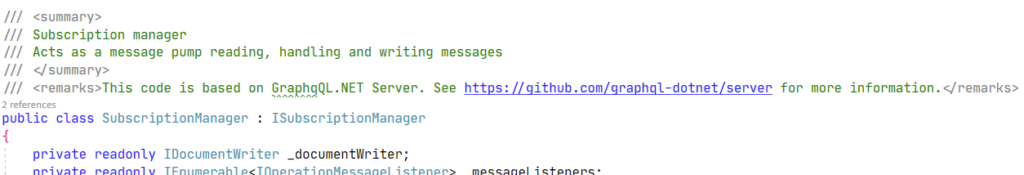
There are only a couple of scenarios where we use websockets in our API and I know them. What I don’t know, is the code that manages all that ; the “infra” part I mean, the code that actually handles websockets and all, not the high level stuff. But we probably use a library that does that for us, right ? Right ?
Time for some more context : we use GraphQL a lot in our API and websockets are used only for GraphQL subscriptions. We use GraphQl.Net to do the boilerplate, leaving us to code mostly the resolvers and types. As for subscriptions however, the documentation tells us that we need “a server that supports the Apollo GraphQL subscription protocol”, pointing to a GraphQL Server project. Let’s see. Uh oh. What we have is a copy/pasta of some classes of an outdated version of GraphQL Server. Not good.
At least now things start to add up, maybe there’s a leak somewhere in this code that was not fixed because we could not keep it up-to-date with the official project. It’s quite thin but it’s the best shot I have so far. I start reading the code and nope, looks like exceptions are handled well and sockets are closed correctly in finally clauses.
Now I’m starting to wonder if I could reproduce the problem locally. I don’t need thousands of connections to spot a retained IISHttpContext. So I fire up my local API in debug mode using IIS express, attach another instance of dotMemory to it and start messing with GraphQL subscriptions, mostly closing browser tabs or windows while they were loading stuff through the websockets. Luckily, we use subscriptions for performance purpose and there are scenarios where the websocket can stay up to one or two minutes, giving me enough time to close stuff manually.
And it works !
Getting there
Reproduction and automation
After a few attempts, I finally manage to get the following results locally :
3 instances of IISHttpContextOfT are leaking. The scenario was basically “open this webpage, wait for the subscription to start loading stuff then switch to this other specific page”. So yeah, it seems it’s related to websockets being closed abruptly. In my Visual Studio, some WebSocketExceptions are encountered but look like they are correctly handled by the catch and finally blocks, so I do not worry.
As a bonus, the key retention paths are much more verbose for some reason :
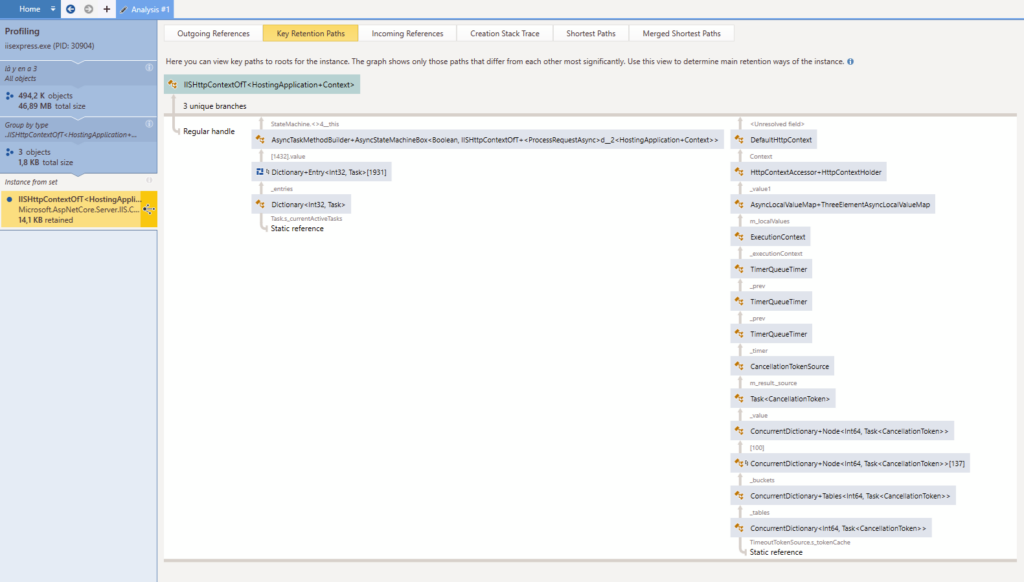
At first glance, there’s nothing here that will help me find what’s wrong in my own code. Some dictionaries in an async context, some other dictionaries and timers… hmpf. But all this “async” stuff makes me want to go back reading the code and check what is done asynchronously. Maybe we are missing an async keyword somewhere in the case the websockets are not closed correctly ?
Now that I have a clear reproduction scenario, I automate it with Gatling because it handles websockets too. I can reproduce the issue easily AND quickly, so that’s quite a relief.
Uncompleted tasks
I keep on reading the code that manages websockets and after a while, I stumble upon this :
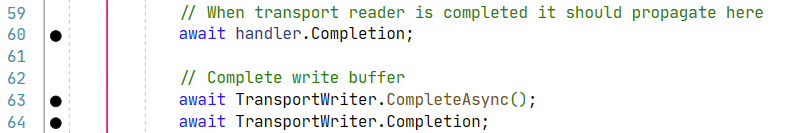
OK so we have an async context and we are waiting for something to complete before calling some code that will probably clean up stuff. That’s a solid candidate for a breakpoint. And indeed, the breakpoint is hit when the websocket is closed normally by the client, but it’s not hit in the case of an aborted connection. Looks good ! In the end, somewhere in the stack, I finally find the culprit :
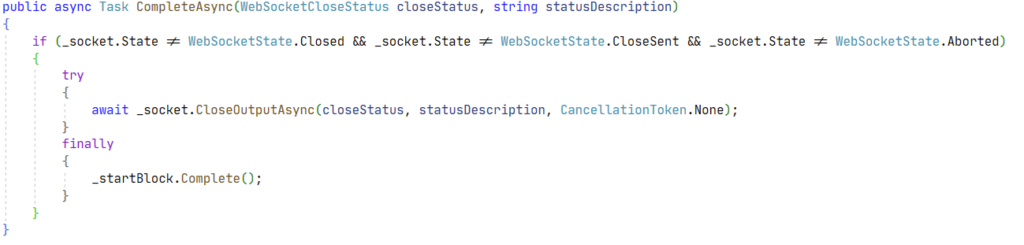
In case of a wild disconnection, the socket state is “Aborted”. Meaning we will not got into the “if” block, which is good to avoid the CloseOutputAsync call, but not so good for the finally clause : the _startBlock task will not be called on the Complete method and it will probably remain in memory, waiting forever. Hence all my trouble. After a quick local fix consisting mostly in adding an else clause for the Aborted case and completing the Task there, there appears to be no more memory leak.
Fixed !
The fix was deployed into production last week and the latest snapshot (made 2 days after the fix was delivered) shows the problem is apparently gone :
All that remains now is the known issue with the OraclePoolManager for which we will have to find a solution. About the IISHttpContextOfT problem, I am considering making a pull request to the graphql-server open source project but it would mean reproducing the memory leak in an entirely new environment and I am not sure I have the energy for this. So I have opened an issue instead.
Conclusion
That was quite a ride. Reading this in 10 minutes might make it look like it was quick. It was not. It took me about 5 working days (minus some meetings) to finally find a probable fix. I did not mention all my mistakes, wrong assumptions, calls for help (big thanks to Guillaume L, Nathanael et Pierrick from the Okiwi community !), mostly because it was quite specific to my issue or lack of knowledge. Everything I have learned is here in this post.
Quick tips :
- Grasp the basics of garbage collection in .Net. It’s not very hard and will help you a lot distinguishing the wheat from the chaff.
- Get a proper tool for analysis. I have only used dotMemory so far, so I cannot compare with any other tool. But it is mandatory to have one, as well as reading its documentation.
- You’ll be reading far more code than you will be writing. In the end, the fix I committed is 5-line long. I also cleaned up some other stuff here and there but the core of the fix is 5 lines.
- Once you find out the leak, focus on getting a reproduction scenario as much as possible and then automate it, preferably on your local environment. This alone probably saved me several hours of boring clicks on our website.
- Read this piece. It did not help me find the bug but made me aware of various good/bad practices with ASP .Net Core.
- Follow your instincts ! Some things will look related but you won’t be able to prove it ; try them anyway. That’s what happened when I linked the HttpContext and the WebSocket. Nothing more than a hunch but it proved fruitful.
I will update this post with any development that might occur ; until then, stay safe 🙂

Software developer since 2000, I try to make the right things right. I usually work with .Net (C#) and Azure, mostly because the ecosystem is really friendly and helps me focus on the right things.
I try to avoid unnecessary (a.k.a. accidental) complexity and in general everything that gets in the way of solving the essential complexity induced by the business needs.
This is why I favor a test-first approach to focus on the problem space and ask questions to business experts before even coding the feature.